LiveView Interactions with SVGs
- Published on
Context
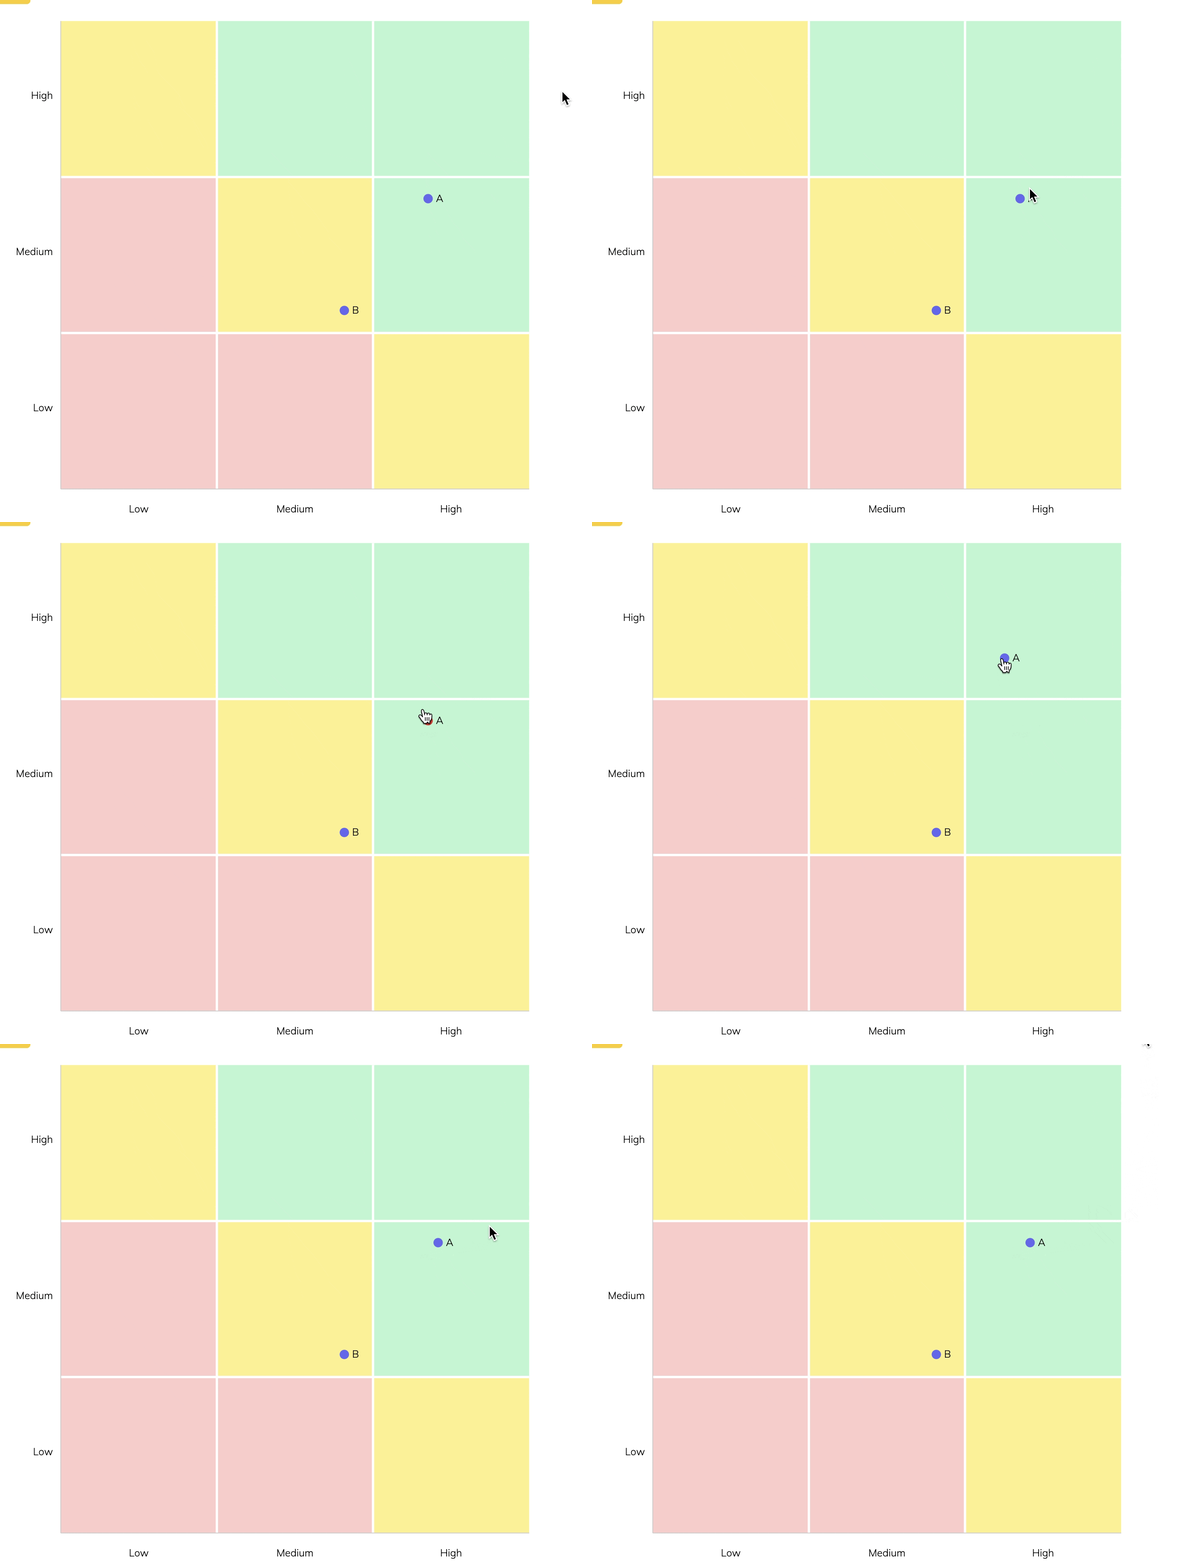
Leaning into the idea of "growing a team", I have been building features into TalkCoffeeTo.me focused on team management, including 1-1s, 9-box diagrams, and soon career progression and leveling systems. I have a vision for how each feature works and how users interact with it. For nine box diagrams, I imagined an SVG chart with color-coded box areas and individually labeled points that the user could click and move the points into different regions.
A 9-box diagram is a tool used in human resources and management to evaluate and identify the potential of employees within an organization. The diagram is typically arranged in a 3x3 grid, with each box representing a different level of performance and potential. The horizontal axis typically represents an employee's current performance level, while the vertical axis represents their potential for future development or advancement. The resulting matrix allows managers to quickly identify high-potential employees who may be ready for promotion or additional development opportunities.
The Problem
My initial attempt at this 9-box diagram feature worked except for the user interaction. I wanted to drag and drop points on this diagram, but LiveView didn't support drag events natively. Instead, a two-click method works almost as well. The user clicks on a point in the diagram, the point gets highlighted, and then the user clicks another spot on the graphic for the point's new location.
This solution worked well until I made the SVG responsive -- the new coordinates didn't always match up with the clicks. Attempting to move a point would send it off the destination, sometimes even offscreen. This effect would be worse the as the graphic got smaller or much larger.
What was going on?
SVG uses viewbox to define the view of the elements from the user's perspective and determines the size of the units the elements use for sizing and spacing. I usually define the viewbox as the ultimate graphic size and allow CSS to do the appropriate sizing. Using the viewbox this way keeps things simple within the SVG.
Take this little drawing as an example:
<svg viewBox="0 0 50 50" xmlns="http://www.w3.org/2000/svg">
  <rect x="0" y="0" width="100" height="100" />
  <circle cx="20" cy="20" r="10" fill="white" />
</svg>
In SVG coordinates, the origin (0,0) is the top-left corner of the graphic. No matter how you scale the window with the SVG on this page, the SVG internally stays the same as the overall graphic changes size. I use this same principle with the countdown timer on boards in TalkCoffeeTo.me, but those do not have any user interactions.
LiveView optionally supports click metadata on the LiveSocket, including client, page, screen, and offset. offset is of interest here since it is the distance in pixels relative to the parent container. Suppose the SVG origin lines up with the HTML parent origin, i.e., there's no padding or margin on the SVG within an empty <div>. Then the offset event metadata will include the pixel distance from the SVG's origin. This explanation is a complicated way to say that we can line up the parent container and SVG to use the pixel coordinates and then read that in LiveView events.
This solution only works if the SVG is not scaled. One hundred pixels in the SVG must be one hundred pixels rendered on the page. When I made this graphic responsive, I lost this equivalent coordinate system. To correct this issue, we need to figure out the scaling of the SVG in LiveView.
The Solution
First, here's a significantly simplified template and event structure for this explanation.
<div id="ninebox-parent">
    <svg phx-click="plot-click" viewBox="0 0 800 800" id="ninebox">
        <%= for point <- @points do %>
            <circle phx-click="point-click" phx-value-point-id={point.id} cx={point.x} cy={point.y} r="6"></circle>
        <% end %>
    </svg>
</div>
Each point is a circle in the SVG with a Phoenix click event called point-click. The whole diagram listens for clicks and sends the event plot-click. Since we can get the offsetX and offsetY of any click event on the points and know the point's original X and Y, we can use this to determine the scaling factor for each dimension.
def handle_event("point-click", %{"point-id" => point_id, "offsetX" => offsetX, "offsetY" => offsetY}, socket) do
    point = get_point!(point_id)
    scaleX = offsetX / point.x
    scaleY = offsetY / point.y

    {:noreply, socket
    |> assign(:scaleX, scaleX)
    |> assign(:scaleY, scaleY)
    }
end
Then we can apply this scaling factor to the new click location and update the point's coordinates.
def handle_event("plot-click", %{"offsetX" => offsetX, "offsetY" => offsetY}, socket) do
    point = get_nine_box_point!(socket.assigns.highlighted_point_id)
    newX = offsetX / socket.assigns.scaleX
    newY = offsetY / socket.assigns.scaleY

    update_point(point, %{"x" => newX, "y" => newY})

    {:noreply, socket
    |> assign(:points, list_nineboxpoints(socket.assigns.nine_box.id)) # refreshes the points to force a redraw
    }
end
The complete code takes this idea much further, but this is the crux of the solution.
